Showing posts with label Root-Cause. Show all posts

Wednesday, March 12, 2014

Extend Equipment Mean Time Between Failure (MTBF) with Clean Oils

I attended an STLE Section meeting last week to improve my knowledge on lubrication and discovered that any sized particle will lower the expected life of as shown on the MacPherson Curve.
From the presentation, "80% of failure in circulating systems are caused by contamination".  The presenter discussed how on a hydraulic driven roller press, they had pump failures every six months.  After filtering to the 3 micron size or better, the pump has now run for three years without a rebuild.  This is an incredible result of simply doing a very good job of filtering the oil.  

There is a very good article that explains the specific details which you can read here: http://www.machinerylubrication.com/Read/1291/lubricant-cleanliness

Thursday, April 18, 2013

Analyzing Grease

Like oil analysis, grease sampling and analysis can provide some great information.  For high risk equipment it may be appropriate to consider adding a grease analysis strategy to your program.  Some of the key ways the analysis could be used:

1.) Root-cause or failure analysis - as noted in previous posts, most bearing failures are not due to bearings wearing out, but rather a failure of the lubrication and most bearings are grease lubricated and this would be a great tool to look for water content, external contaminates, or break down materials.
2.) Lubrication Consolidation - not all greases are compatible and sampling grease on a new machine, or unknown machines could be very valuable as you develop a consolidation plan.
3.) Wear analysis - use sampling as an early warning on bearing failure

In the January-February 2013 issue of Machinery Lubrication, Steffen Bots provided a very good overview of grease sampling and analysis that is a recommended read if you want more details on grease analysis.  You can find the article here: http://www.machinerylubrication.com/Read/29284/grease-analysis-system

Wednesday, January 16, 2013

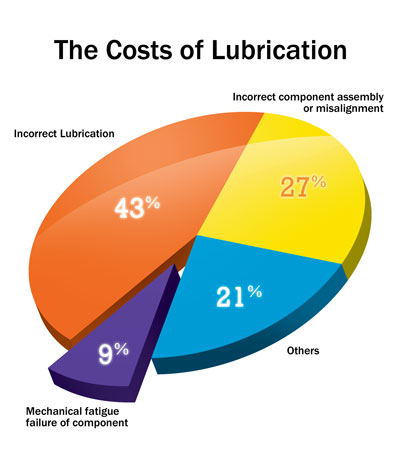
Just 9% of Lube Related Failures are Fatigue


I just read an article yesterday that quoted a study that said just 9% of lubrication related mechanical failures are due to fatigue.  43% are related to lubrication issues. 
So my "New Years Resolution" is to work on learning and educating my staff on lubrication.  This looks like a good application of the Pareto Principal and we can leverage some real improvement.

Check out the article here: http://www.machinerylubrication.com/Read/28752/business-case-for-lubrication-excellence-

Best wishes for 2013!

Tuesday, December 01, 2009

Expand Root-Cause to Find Solutions

In several other posts, I have recommended thinkreliability.com materials and video's. Here is another recommendation to explore their video and webinar library.

This is a short video reviewing the Hubble Telescope problems and solutions. As you may recall, the Hubble Telescope is a space based telescope launched in the early 1990's at a cost of $1.5 Billion, however, it had a flaw in the mirror which made all of the images blurry.

Thinkreliability.com explores the root-cause review and demonstrates how the solution didn't have anything to do with the mirror which was the actual cause of the problem: http://www.thinkreliability.com/Video/Hubble/Hubble7min.html

As you do RCFA, don't let the search for the cause limit your options for the solutions.

Wednesday, October 21, 2009

Root-Cause Analysis and FMEA Similarities

It sometimes seems that there are competing "tools" used to improve reliability of equipment. Pickup any of the industry magazines the there is always a presentation of one "new" technique or another: Reliability Centered Maintenance (RCM), Failure Modes and Effects Analysis (FMEA), Root-Cause Analysis (RCA), and others. I have seen similarities between many of these tools, but a recent free webinar put on by Think Reliability did an excellent job of showing how RCA and FMEA are very closely related and support each other.

You can find the video here: http://www.thinkreliability.com/video/2009-10-13-RCA-FMEA/2009-10-13-RCA-FMEA.html

Friday, September 18, 2009

Improving on a Fishbone for Cause-Effect

I attended another FREE Friday morning Webinar put on by thinkreliability.com that discussed how the Ishikawa Fishbone diagram can be improved upon for doing a cause and effect analysis.

A summary video of the webinar has been posted here: http://www.thinkreliability.com/video/FishboneLastEdited/FishboneLastEdited.html

Like thinkreliability.com's other video's and materials I have reviewed here, the focus is on making the analysis as graphical and detailed as possible. The goal is to make it as user friendly as possible, helping to facilitate discussion and to document the process and ideas. Discussing and documenting are the very foundation to achieving any problem solution.

Monday, August 31, 2009

Work Process Improvement and Root-Cause

Last week I attended a webinar put on by Think Reliability that focused on how work processes need to be more carefully evaluated and documented to eliminate actual failure points in the work process rather then just leaving a root-cause analysis at "Procedure Not Followed". Think Reliability has published a summary of this 45 minute webinar as a sixteen minute summary which is definitely worth watching.

Previously on this blog, I have written about change management for organizations. While the focus of Think Reliability's presentation was on using root-cause analysis approaches to resolve work process problems, the discussion is also key to helping an organization to become a "Learning Organization". I especially liked the following graphic:


Notice how it is important to transition from the "eye lash" approach to each employee learning from zero to the "learning organization" approach where the work processes are understood, best practice's are identified, and training is provided to each new employee to improve the process.

You can find the summary video from the Webinar here: http://www.thinkreliability.com/video/Proced-Not-Followed/Proced-Not-Followed-Part1-Aug-09.html

See other blog posts on Work Flow:
http://www.napam.net/index.php?option=com_content&view=article&id=46&Itemid=46#Sect_2

http://ydesign72705.blogspot.com/2008/12/coding-and-organization-for-cmms.html

Sunday, June 21, 2009

Best MS Excel Webinar I have attended

Last Friday, I attended a webinar put on by thinkreliability.com that was one of the best 45 minutes I have spent on training recently. It really was focused on how to use Microsoft Excel 2003 for cause and effect diagramming, but I think you could use the technics shown for much more including:

1.) Workflow diagramming (look for more discussion on this later)

2.) Process Flow diagramming

3.) Hierarchy relationship diagrams

and much more......

About three minutes of the presentation is available for a sample here: http://thinkreliability.com/video/Excel03-tips-1min42/Excel03-tips-1min42.html

You can also download their MS Excel Template for doing cause and effect diagramming at their website http://www.thinkreliability.com and signup for their next webinar training session.

Definitely worth it in my opinion!

Thursday, January 01, 2009

Root-Cause Analysis - Beginner Intro and More

Root-Cause analysis should play an important part in a good asset manage program. Asset management program is based on the Plan-Do-Check-Act (http://en.wikipedia.org/wiki/PDCA) concepts that grew from Deming's work in the 50's - 80's in manufacturing, so a key feedback part of the program must include questioning why the results observed don't align with the results anticipated. Root-cause analysis is an excellent tool for structuring the review of why a failure occurred, and should be a tool in the asset management toolbox.

There are many approaches to Root-Cause Analysis or Root-Cause Failure Analysis (RCFA), including the 5 Why's, Ishikawa diagram or fishbone diagrams (http://en.wikipedia.org/wiki/Fishbone_diagram), Cause-Mapping, and others. Earlier in August 2008, I wrote a short note to my scrapbook blog on a free root-cause tool that you could use as a guideline for doing your root-cause analysis: http://ydesign72705.blogspot.com/2008/08/root-cause-using-cause-mapping.html

Recently, I got another email from the thinkreliability.com, who is the provider of this free root-cause tool, announcing a link to a new short video that provides some definitions to the word "cause" and also a "root-cause".

You can find the video here: http://www.thinkreliability.com/video/RCCF-Gv6/RCCF-Gv6.html .

Identification of a root-cause is a difficult task and it requires some careful thinking about terminology and a real effort to not "leap" to a solution. I don't completely agree with the thinkreliability.com and my guess is because they are intending this as an introduction to the topic they didn't get into the more detailed points. For the purpose of introduction, it is certainly worth watching and giving it some thought. Pay special attention to the analysis about the root-cause of a fire. Do you agree? Leave comments below.

Sunday, August 31, 2008

Robust Design for Systems or Processes

A key to recent success in the manufacturing industry has been the application of Robust Design or Taguchi Method. While the details of the process get deeply into statistical mathmatics, the concepts are quit simple.


This diagram demonstrates the key relationships between any process or system and its environment. The "signal factors" are the inputs into the system, this may include a product at a certain stage in a process and then there is the "response" which is the condition of the product after it has been through the process or system. For this "black box" there are also system inputs which includes "noise", things that can't be controlled, and "control Factors" things which can be controlled.

As system operators, we operate many systems where we attempt to control the process or system with our control factors. The lesson that we learn from Robust Design process is that these control factors often have a complex and difficult relationships. Many times we attempt to control a process or system response by varying certain control factors and ignoring others, without any understanding of how these processes relate to each other. Robust Design when applied allow you to determine the "Control Factors" which have the most leverage in the control relationship.

Incidentally, these "Control Factors" would make great Key Performance Indicators (KPI)'s for controlling your process or system.

Robust Design is not often discussed in the context of Asset Management, however, using the statistical strategies to evaluate failure data could be very beneficial in determining techniques that will allow significant extension of life.

Thursday, August 28, 2008

Defining Cause for a Root-Cause Analysis: The Video

Earlier in August 2008, I referred you a free root-cause tool that you could use as a guideline for doing your root-cause analysis: http://ydesign72705.blogspot.com/2008/08/root-cause-using-cause-mapping.html

Today, I got an email from the provider, thinkreliability.com, of this free root-cause tool that included a link to a new short video that provides some definitions to the word "cause" and also a "root-cause".

You can find the video here: http://www.thinkreliability.com/video/RCCF-Gv6/RCCF-Gv6.html .

Thursday, August 14, 2008

Root-Cause using Cause Mapping

Think Reliability is offering a free, with a sign-up for their newsletter, a Microsoft Excel template for doing root-cause analysis using the Cause Mapping approach. I downloaded a copy and will play with it a bit. If it looks good, I will likely mention this in the PNCWA Newsletter's and recommend it to others.

For those of you who are adventures, jump over and download it and please let me know what you think of the Cause Mapping process. Notice on the website that Think Reliability is also offering a training session (one in Seattle next week) around the country over the next couple of months. You might want to join them if it looks like it would benefit your organization.